
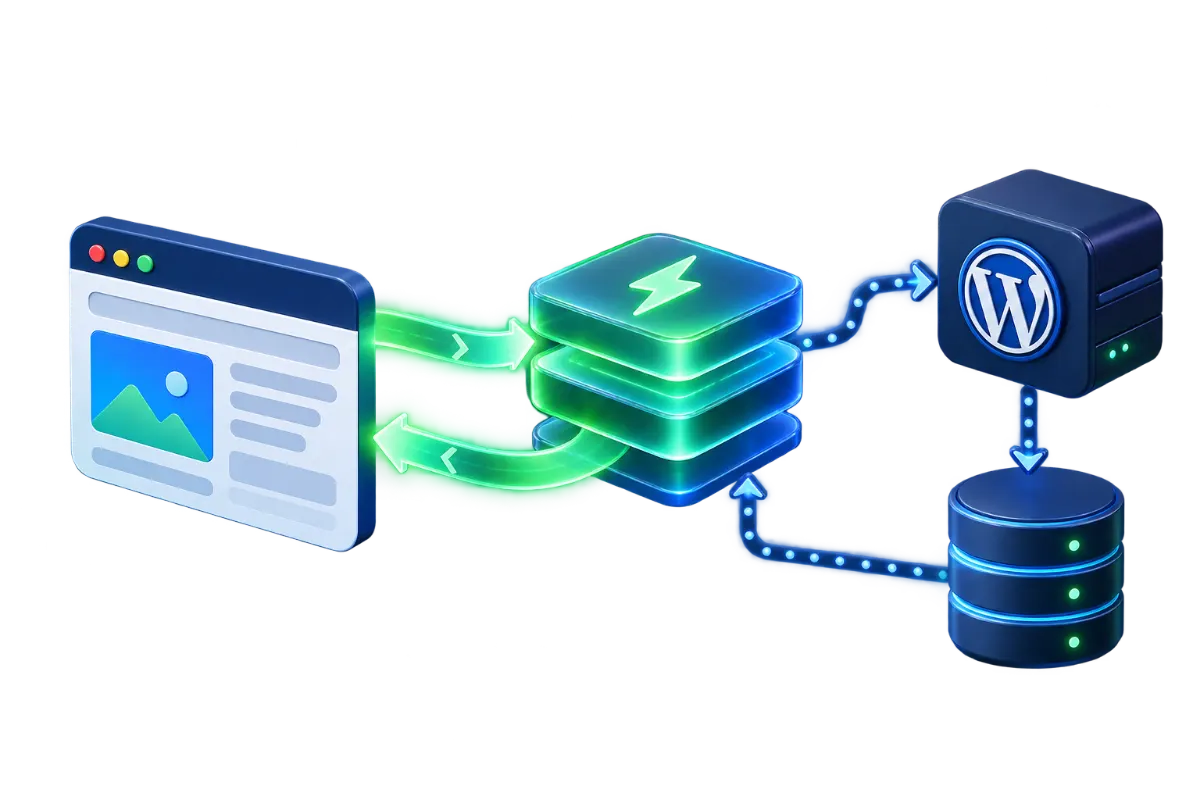
"Monitoring" often gets treated as synonymous with an uptime check — is the server responding, yes or no — but a complete monitoring setup watches several genuinely different signals, each catching a different class of problem a simple ping check would miss entirely. The gap between a problem occurring and someone finding out about it is determined almost entirely by what's being watched and how sensitively alerts are tuned.
What a monitoring setup actually watches
Uptime checks confirm a server is reachable — see What Is Server Uptime and How Should It Be Measured? for how that specific measurement works. Response time monitoring tracks how long requests take to complete, which catches a site that's technically up but has degraded to the point of being effectively unusable — a slow failure that an uptime check alone reports as perfectly healthy. SSL certificate expiry monitoring watches the validity window of a site's certificate and alerts well before it lapses, since an expired certificate presents visitors with a browser security warning that functions, for most visitors, identically to the site being down. Performance monitoring, often built around the same Core Web Vitals metrics covered in Core Web Vitals for Business Websites, tracks real-world loading experience over time rather than just a single pass/fail check. Error monitoring watches for application-level errors (500 responses, exceptions in application logs) that a basic connectivity check wouldn't register as a failure at all, since the server is responding — just incorrectly.
Synthetic checks vs. real-user monitoring
Most of what's described above — scheduled checks hitting the site from an external location at fixed intervals — is called synthetic monitoring: it's a controlled, repeatable probe, not an observation of an actual visitor's experience. Real-user monitoring (RUM) is a different approach that captures performance data from actual visitors' browsers as they load the site, which reflects real-world conditions synthetic checks can miss entirely — a visitor on a slow mobile connection, a particular browser with a specific rendering quirk, a geographic region the synthetic checks don't happen to probe from. Synthetic monitoring's strength is consistency and the ability to detect a problem even with zero live traffic (an outage overnight, for instance, still gets caught); real-user monitoring's strength is reflecting what visitors actually experience, including slowdowns tied to specific devices, networks or regions that a single synthetic check location would never see. A thorough setup uses both rather than treating either as a complete picture on its own — synthetic checks as the always-on safety net, real-user data as the more faithful picture of day-to-day visitor experience.
Why check location matters
A synthetic check run from a single location only tells you the site is reachable and fast from that one place — which matters more than it first appears, given how much of perceived performance ties back to the geographic distance covered in What Is a CDN and When Does Your Website Need One?. A site monitored only from a check location near its own server can look perfectly healthy while visitors in a distant region experience real slowdowns the monitoring never detects, simply because the check never travels that distance itself. Monitoring from multiple geographic locations closes that blind spot, and it also helps distinguish a genuine server-side outage (which shows as down from every check location at once) from a localized network issue affecting only one region (which shows as down from one location while the others report normally) — a distinction that changes where you'd even start looking for the cause.
Setting alert thresholds that mean something
A threshold set too sensitively generates alert fatigue — enough false alarms that real ones start getting ignored or missed among the noise. A threshold set too loosely misses problems that matter. Consider response time: if a site's normal response time hovers around 400-600ms, alerting on every request that takes longer than 600ms will trigger constantly on ordinary variance, teaching whoever receives the alerts to tune them out. A more useful threshold alerts on a sustained pattern — response times staying above, say, 2 seconds for several consecutive checks, or a clear step-change from the normal baseline — which filters out routine jitter while still catching a genuine degradation quickly. The same logic applies to uptime: alerting on a single failed check can trigger on a one-off network blip that resolves itself before anyone could act on it anyway, while requiring two or three consecutive failed checks before alerting filters out those transient blips without meaningfully delaying detection of an actual outage.
Where alerts actually go
An alert that goes somewhere nobody checks regularly is functionally the same as no monitoring at all. Email alerts are the most common default but are easy to miss among routine inbox volume, especially outside business hours; SMS or phone-call alerts for genuinely critical issues (full outages) cut through in a way email doesn't; integrations with team chat tools put alerts somewhere a team already has visibility during work hours. Matching severity to channel — routine performance degradation to a channel someone checks periodically, a full outage to something that actually interrupts whoever's on call — is part of what makes a monitoring setup useful rather than just present. For a small team without a formal on-call rotation, the simplest version of this is still worth setting up deliberately: one clearly designated person or shared channel for critical alerts, rather than an alert going to an individual's personal inbox that happens to go unread over a weekend precisely when it mattered most.
What to monitor first on a limited budget
- Basic uptime/availability checks on the main site and any critical subdomains (a store checkout path, an API endpoint other systems depend on) — the highest-value, lowest-cost starting point.
- SSL certificate expiry monitoring — a single alert a few weeks before expiry prevents an entirely avoidable, self-inflicted outage.
- Response time tracking against a known baseline — even simple tracking is enough to notice a degrading trend before it becomes an outage.
- Error-rate monitoring on the application itself, once the basics above are in place — catches problems a connectivity check structurally can't see.
Most of this doesn't require expensive tooling to start — a basic uptime and SSL expiry check costs little and catches a disproportionate share of avoidable incidents relative to its cost, with response-time and error-rate monitoring reasonable to add once the simpler layer is already running reliably. It's worth resisting the urge to enable every available check and alert type on day one — a monitoring setup that generates more noise than a small team can realistically act on tends to get its alerts muted or ignored within a few weeks, which quietly defeats the purpose. Starting narrow, confirming the team actually responds to what gets raised, and expanding coverage from there produces a setup that's still being paid attention to six months in, rather than one that technically covers everything but whose alerts nobody opens anymore. It's also worth revisiting the setup after any significant change to the site itself — a new checkout flow, a new API integration, a redesign that changes which pages matter most — since what was worth monitoring closely six months ago isn't necessarily what matters most today, and a monitoring configuration that never gets revisited tends to drift out of alignment with what the site has actually become.